

Have you ever wondered how to quickly understand the big picture when dealing with numbers? Calculating cumulative percentage is a simple trick that can help you see how parts add up to the whole.
Whether you’re tracking your progress, analyzing data, or making decisions, knowing how to find the cumulative percentage gives you a clear, powerful insight. You’ll discover easy steps to calculate it yourself and why it can change the way you handle information.
Ready to unlock this useful skill? Keep reading!
Basics Of Cumulative Percentage
Cumulative percentage is a useful concept in data analysis. It helps to understand the total percentage up to a certain point in a dataset. This measure adds values step by step and shows how they build up over time or categories. Learning the basics of cumulative percentage makes data easier to interpret.
This section explains what cumulative percentage means and why it matters in analyzing data. It breaks down the idea into simple terms for better understanding.
What Is Cumulative Percentage
Cumulative percentage shows the sum of percentages from the start to a specific point. It is the running total of all previous percentages added together. This helps to see the overall share of data up to that point.
For example, if you have values of 20%, 30%, and 10%, the cumulative percentages will be 20%, 50%, and 60%. It gives a clearer picture of how parts contribute to the whole.
Importance In Data Analysis
Cumulative percentage helps spot trends and patterns in data. It shows how values accumulate, making it easier to compare different groups or time periods. Analysts use it to understand growth or decline clearly.
This measure also aids in decision making. It highlights key points where large changes happen. This insight is valuable in business, education, and many other fields.
Credit: learn.microsoft.com
Gathering Your Data
Gathering your data is the first step in calculating cumulative percentage. Accurate and organized data ensures the calculation is correct. You need to collect the right kind of information before starting any math.
Understanding the types of data and how to arrange them helps you avoid mistakes. It also makes the process faster and clearer.
Types Of Data Needed
Start by identifying the data you need. Usually, you need a list of values or numbers. These could be sales figures, test scores, or any data set you want to analyze.
Each data point should represent a part of the whole. Make sure the data is complete and accurate. Missing or wrong numbers will affect your results.
Organizing Data For Calculation
Arrange your data in order from smallest to largest. This order helps track the running total for the cumulative percentage. Use a table or spreadsheet for clarity.
Next, calculate the total sum of all data points. This total is the base for all percentage calculations. Then, list each value with its running sum to prepare for the next step.
Calculating Individual Percentages
Calculating individual percentages is an essential step in finding the cumulative percentage. This process shows how much each part contributes to the total. It helps to understand data clearly by breaking it down into smaller, easy-to-understand pieces. Each percentage tells the share of a single item compared to the whole.
Knowing how to calculate these percentages allows you to analyze data sets effectively. It is useful for reports, surveys, and many other applications. The calculation is simple and follows a clear formula. Once you grasp this, you can apply it to any data set.
Formula For Percentage
The formula to calculate an individual percentage is straightforward. It divides the part by the total and multiplies the result by 100. This gives the percentage value of that part within the whole.
Percentage (%) = (Part ÷ Total) × 100
Using this formula makes it easy to convert numbers into percentages. It provides a clear way to compare different parts of the data.
Examples With Sample Data
Consider a class with 40 students. Out of these, 10 students scored above 90 in a test. To find the percentage of students who scored above 90, use the formula:
Percentage = (10 ÷ 40) × 100 = 25%
This means 25% of the class scored above 90.
Another example is sales data. Suppose a store sold 50 red shirts out of 200 total shirts. The percentage of red shirts sold is:
Percentage = (50 ÷ 200) × 100 = 25%
Here, 25% of the shirts sold were red. These examples show how to apply the formula to real situations easily.

Credit: www.youtube.com
Adding Percentages Step-by-step
Adding percentages step-by-step helps understand cumulative percentage clearly. It shows the total percentage after combining parts. This method is useful in many areas like statistics, sales, and surveys. Learning how to add percentages correctly avoids confusion and errors. Follow these simple steps to calculate cumulative percentage easily.
How To Sum Percentages Correctly
First, list all the percentages you want to add. Make sure each percentage is in the same format, like all decimals or all whole numbers.
Next, add the percentages one by one using a calculator or paper. For example, add 20% and 30% to get 50%.
Check if the total is logical. Percentages usually should not exceed 100% unless they represent overlapping groups.
Use decimals for more precise results. For example, 25% as 0.25 and 40% as 0.40.
Sum the decimals, then convert the result back to a percentage by multiplying by 100.
Common Mistakes To Avoid
Do not add percentages without knowing what they represent. Adding unrelated percentages can cause wrong results.
Avoid adding percentages from different bases. For example, 30% of one group and 40% of another group cannot be added directly.
Do not forget to convert percentages to decimals if needed. Adding whole numbers and decimals together causes errors.
Never assume percentages always add up to 100%. Sometimes the total is less or more, depending on the data.
Check your work carefully to avoid simple math mistakes. Small errors can change the outcome.
Using Tools For Calculation
Calculating cumulative percentage can be easier with the right tools. These tools help you avoid manual errors and save time. They also make it simple to handle large sets of data.
Spreadsheets And Software
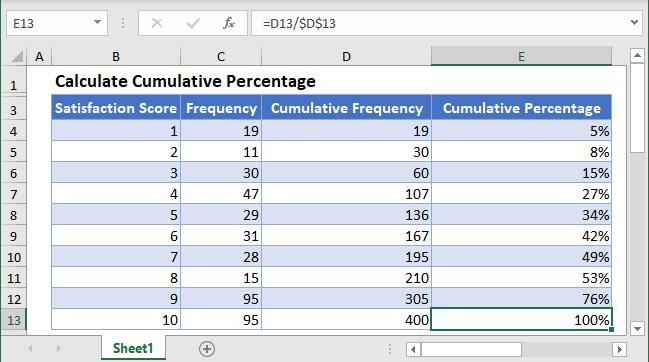
Spreadsheets like Microsoft Excel or Google Sheets offer built-in functions. You can quickly sum values and calculate percentages. Just enter your data, use simple formulas, and get results fast. These tools also allow you to create charts to visualize cumulative percentages. Many software options provide step-by-step guides to assist beginners.
Online Calculators
Online calculators are helpful when you need quick results without software. They require you to input your numbers and instantly show the cumulative percentage. These calculators are free and easy to use on any device. They work well for small sets of data or quick checks. No special skills are needed to use these tools effectively.
Interpreting Cumulative Percentages
Cumulative percentages show the total percent up to a certain point. They help track how parts add up to a whole. Understanding these numbers reveals patterns and trends in data. It makes complex data easier to grasp.
Reading The Results
Start by looking at the cumulative percentage values in order. Each value tells the total share up to that category. For example, 30% means 30% of all data fall within or below that group. Notice how the numbers grow as you move down the list. The last value should be 100%, showing the entire data set.
Check if the percentages rise smoothly or jump suddenly. Smooth rises mean a steady increase. Sharp jumps point to large groups or values. These clues help you understand the distribution clearly. It shows which parts hold the most weight.
Applications In Real Life
Cumulative percentages appear in many real-world areas. In sales, they show what part of total revenue comes from top products. In education, they reveal how many students score below certain marks. In finance, they help evaluate risk or income distribution.
They also guide decisions. Businesses see which products matter most. Schools identify students needing extra help. Investors assess portfolio risks easily. These percentages make data practical and useful.
Credit: www.automateexcel.com
Frequently Asked Questions
What Is Cumulative Percentage In Data Analysis?
Cumulative percentage shows the running total percentage of data points. It helps track progress and understand data distribution clearly.
How Do You Calculate Cumulative Percentage Step-by-step?
Add each value to the previous total, then divide by the grand total. Multiply by 100 for percentage form.
Why Is Cumulative Percentage Important In Statistics?
It helps identify trends, patterns, and data concentration. It simplifies large datasets into understandable insights.
Can Cumulative Percentage Be Used In Surveys?
Yes, it summarizes responses progressively. This helps analyze how opinions or behaviors accumulate over categories.
Conclusion
Calculating cumulative percentage helps show how parts add up to a whole. It makes data easy to understand and compare. Use simple steps: find the total, add values, then divide by the total. This method works well with many types of data.
Practice with examples to get comfortable. Clear understanding helps in studies, business, and daily life. Keep these steps in mind to use cumulative percentage confidently. It’s a handy tool for showing progress and results. Try it yourself and see how numbers tell a story.
As an Amazon Associate, I earn from qualifying purchases.
