
Are you looking to boost your manufacturing efficiency but don’t know where to start? Understanding how to calculate OEE (Overall Equipment Effectiveness) is the key.
It gives you a clear picture of how well your equipment is performing and highlights areas that need improvement. By mastering this simple calculation, you can uncover hidden losses, reduce downtime, and increase productivity. Keep reading, and you’ll learn exactly how to calculate OEE step-by-step, so you can take control of your operations and make smarter decisions that save you time and money.

Credit: www.clearmark.uk
What Is Oee
OEE stands for Overall Equipment Effectiveness. It is a key measure of how well a manufacturing operation runs. OEE shows how much of the planned production time is truly productive.
This metric helps identify losses in manufacturing processes. It highlights issues like downtime, slow cycles, or defects. By tracking OEE, companies can improve efficiency and reduce waste.
Definition Of Oee
OEE measures the percentage of manufacturing time that is productive. It combines three factors: availability, performance, and quality. Each factor reflects a different type of loss during production.
Why Oee Matters
OEE shows how well machines and processes work together. It helps managers spot problems quickly. Improving OEE leads to better use of resources and higher output.
Components Of Oee
Availability measures the time equipment runs versus planned time. Performance looks at speed compared to the ideal cycle time. Quality tracks good parts made against total parts produced.
Credit: www.certaintysoftware.com
Key Components Of Oee
OEE stands for Overall Equipment Effectiveness. It measures how well a manufacturing process runs. OEE breaks down into three key parts. Each part shows a different area of performance. Understanding these parts helps improve production and reduce waste.
Availability
Availability shows the time equipment is running. It compares actual running time to planned production time. Downtime lowers availability. This includes breaks, machine failures, and setup times. High availability means machines run as planned.
Performance
Performance measures how fast the equipment runs. It compares actual speed to the ideal speed. Slow running or small stops reduce performance. A high performance score means machines work at full speed.
Quality
Quality tracks good products made versus total products. It counts defects and reworks. Poor quality lowers this score. A high quality score means fewer defects and better products.
Collecting Data For Oee
Collecting accurate data is the first step in calculating Overall Equipment Effectiveness (OEE). It helps you understand how well your machines and processes perform. The data focuses on three key areas: production time, downtime, and output quality. Each area provides essential information to measure your equipment’s efficiency.
Tracking Production Time
Production time is the total time your equipment runs to make products. Track the start and stop times for each shift. Record any planned breaks or maintenance that pause production. Accurate tracking shows how much time is truly available for making products.
Recording Downtime
Downtime is the time your equipment is not working due to problems. Note every stoppage, its cause, and length. Common causes include machine breakdowns, setup changes, or material shortages. Tracking downtime helps identify issues lowering your equipment’s performance.
Measuring Output Quality
Output quality measures how many products meet standards. Count good units and reject or rework units separately. This data shows the percentage of quality output. High quality output means less waste and better use of production time.

Credit: scw.ai
Step-by-step Oee Calculation
Calculating Overall Equipment Effectiveness (OEE) helps you measure how well your equipment performs. OEE combines three key rates: availability, performance, and quality. Each rate shows a different part of the machine’s efficiency. Understanding these rates step-by-step makes OEE easy to calculate and use.
Calculate Availability Rate
Availability rate shows how much time the machine runs compared to planned time. Start by subtracting downtime from total planned production time. Then divide the operating time by planned time. Use this formula:
Availability = Operating Time ÷ Planned Production Time
Determine Performance Rate
Performance rate measures how fast the machine works compared to its ideal speed. Find total units produced and multiply by ideal cycle time. Divide this by operating time. The formula looks like this:
Performance = (Total Units × Ideal Cycle Time) ÷ Operating Time
Find Quality Rate
Quality rate shows the percentage of good units made from total units produced. Subtract defective units from total units, then divide by total units. The formula is:
Quality = Good Units ÷ Total Units Produced
Combine Rates For Oee
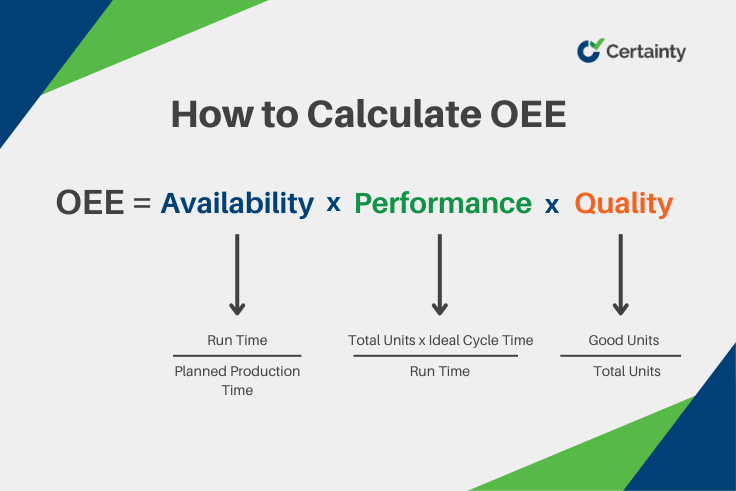
Multiply availability, performance, and quality rates to get OEE. Express the result as a percentage. The formula is:
OEE = Availability × Performance × Quality
Common Oee Challenges
Calculating Overall Equipment Effectiveness (OEE) helps measure manufacturing productivity. Many face challenges that affect accurate OEE calculation. These challenges can lead to wrong conclusions and poor decisions. Understanding these common problems improves OEE accuracy and usefulness.
Inaccurate Data Collection
Data is the base for OEE calculation. Incorrect or missing data causes wrong OEE scores. Manual data entry errors happen often. Sensors and machines may not report data correctly. Regular checks and automation reduce data errors.
Misinterpreting Results
OEE numbers need careful analysis. A low OEE score does not always mean poor performance. Context matters a lot. Comparing OEE across different machines or shifts without considering factors can mislead. Training helps teams read OEE results right.
Ignoring Small Losses
Small losses in production add up over time. Ignoring minor stops or slow cycles lowers OEE accuracy. These small issues often go unnoticed but affect efficiency. Tracking every loss, big or small, gives a clear OEE picture.
Improving Oee For Maximum Efficiency
Improving Overall Equipment Effectiveness (OEE) helps businesses get the most from their machines. It shows how well equipment runs, how fast it works, and the quality of the output. Boosting OEE means using machines smarter, cutting waste, and raising profits. Focus on three key areas to increase OEE: downtime, performance, and quality.
Reducing Downtime
Downtime happens when machines stop working. It lowers OEE and wastes time. Track every stop, planned or not. Fix small issues before they grow. Use quick maintenance to avoid long breaks. Train staff to spot problems early. Keep spare parts ready to speed repairs. These steps keep machines running longer.
Optimizing Performance
Performance measures how fast machines run compared to their best speed. Slow machines reduce OEE. Check machine settings often. Remove anything slowing the process. Use data to find bottlenecks. Balance workloads to avoid overloads. Small changes in speed add up to big gains.
Enhancing Product Quality
High quality means fewer defects and less waste. Defects lower OEE and cost money. Train workers on quality checks. Use better materials and tools. Inspect products regularly to catch errors. Fix problems fast to avoid repeats. Quality focus keeps customers happy and OEE high.
Using Oee Software Tools
Using OEE software tools makes calculating Overall Equipment Effectiveness easier and faster. These tools collect data directly from machines and processes. They provide accurate numbers without manual errors. This saves time and improves decision-making on the shop floor.
OEE software shows real-time performance metrics clearly. Users can see availability, performance, and quality rates instantly. This helps identify problems quickly and track improvements over time.
Automated Data Collection
OEE software connects to machines to gather data automatically. It tracks runtime, downtime, and production speed without human input. This reduces mistakes and ensures data is always up to date.
Instant Oee Calculation
The software calculates OEE automatically using collected data. It breaks down the score into availability, performance, and quality. This helps users understand which area needs attention.
Visual Reports And Dashboards
OEE tools display information in easy-to-read charts and graphs. Dashboards show current and past performance trends. Operators and managers can quickly spot issues and track progress.
Alerts And Notifications
Some OEE software sends alerts when performance drops. These notifications help teams react faster to problems. Immediate action can reduce downtime and improve efficiency.
Integration With Other Systems
OEE software often works with other factory systems. It can share data with maintenance and quality control software. This creates a complete view of production health and supports better planning.
Frequently Asked Questions
What Is Oee In Manufacturing?
OEE stands for Overall Equipment Effectiveness. It measures manufacturing productivity by combining availability, performance, and quality metrics. OEE helps identify production losses and improve equipment efficiency. It is expressed as a percentage, where 100% means perfect production without any downtime or defects.
How Do You Calculate Oee Percentage?
To calculate OEE, multiply Availability, Performance, and Quality percentages. Availability = Operating Time / Planned Production Time. Performance = Actual Speed / Ideal Speed. Quality = Good Units / Total Units Produced. The formula is OEE = Availability × Performance × Quality, usually expressed as a percentage.
Why Is Oee Important For Factories?
OEE identifies hidden production losses and inefficiencies. It helps manufacturers optimize processes, reduce downtime, and improve product quality. Using OEE data allows better decision-making and increases overall productivity. It is a key performance indicator for continuous improvement in manufacturing.
What Factors Affect Oee Calculation Accuracy?
Accurate data on operating time, speed, and quality is essential. Inaccurate recording of downtime or defects leads to wrong OEE results. Consistent definitions of planned production time and ideal cycle time also impact accuracy. Proper training and automated data collection improve OEE reliability.
Conclusion
Calculating OEE helps measure how well machines work. It shows where time, speed, or quality slow down. Simple math makes it clear and easy to use. Tracking OEE often leads to better decisions and fixes. Small changes can improve production and save money.
Always check your numbers to keep improvements real. Use OEE as a tool to watch and grow your process. It’s a clear way to see what works and what doesn’t.
As an Amazon Associate, I earn from qualifying purchases.
